
Posted on: 10th August 2018
In the first two blogs in this series, I gave a brief overview about aluminium surface cleaning followed by cleanliness measurement methods using microscopy. In this blog, I am going to talk about how to quantitatively analyse aluminium etching using another two optical approaches. These are spectrophotometry and colourimetry.
In the same way as the optical microscopy methods described in my last blog, these two techniques depend on the optical characteristics of the disturbed layer. This layer reduces the reflectivity of visible light, particularly in the short wavelength range.
Because these techniques are simple to use, accurate and high efficiency, they are perfect for near-to-line use. Furthermore, sample preparation requirements are the same as for optical microscopy. We think the aluminium sheet rolling industry should use these techniques more widely. They would help to improve surface quality control and optimise cleaning processes in production.
Spectrophotometry
Spectrophotometry is the quantitative measurement of the reflection or transmission properties of a material surface as a function of wavelength. For aluminium surface cleanliness measurement, we’re interested in the reflectance of the aluminium surface over the visible light wavelength range (380 – 780 nm).
The reflectance measurement we use is total reflectance (TR). It is strongly influenced by the level of aluminium etching. Measurement requires an integrating sphere to collect both the specular and diffuse reflectance of light from the aluminium surface.
Spectrophotometry and the disturbed layer
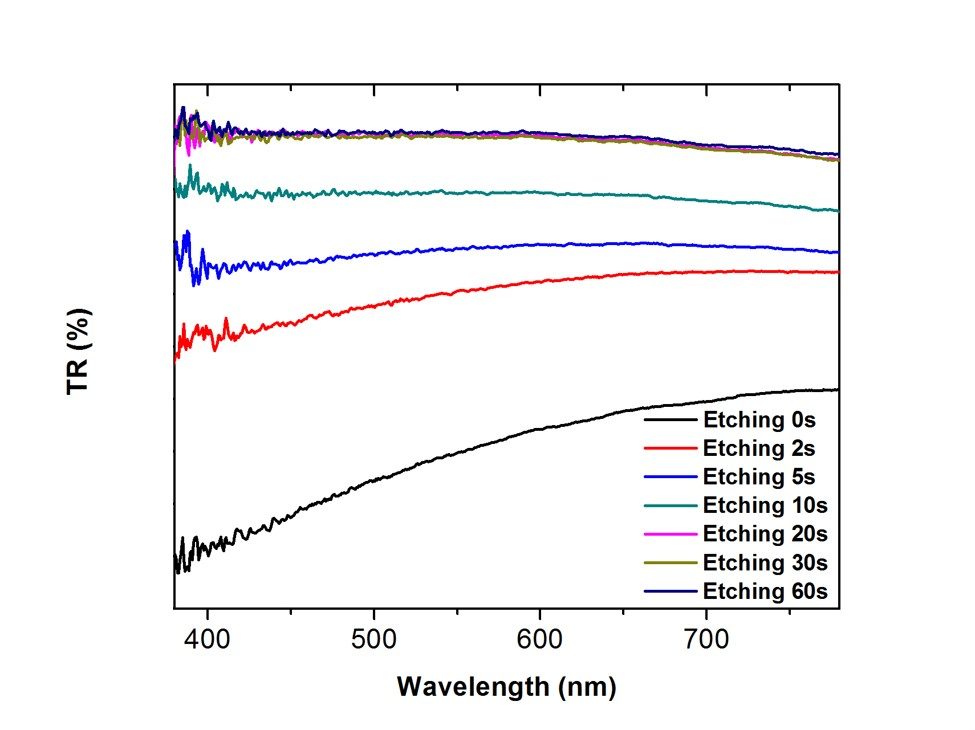
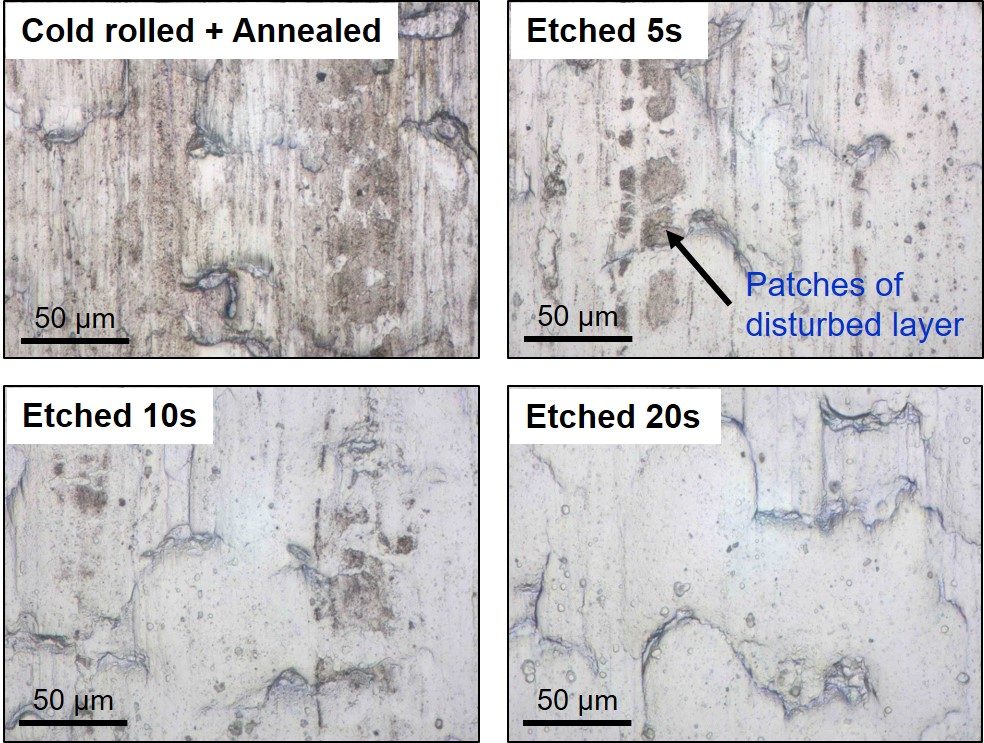
Normally an uncleaned aluminium sheet surface shows low TR. This is especially true at the blue end (380 nm) of the visible light spectrum. We can see this in the profile for no etching in Figure 2. The higher reflectance at the red end (780 nm) is called the red shift. This is due to the presence of the disturbed layer and is consistent with the brown appearance of the sheet surface which you can see in the top left image in Figure 1.
On progressive aluminium etching, the TR increases and the level of red shift reduces gradually until all the disturbed layer has been removed. We can see this in the optical microscopy images in Figure 1.
Figure 2 shows that 20 seconds of alkaline etching followed by acid de-smutting is sufficient to remove all disturbed layers from the AA5182-O automotive sheet sample. Further cleaning does not change the TR or the level of red shift.
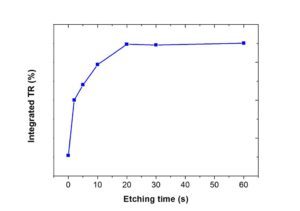
We can calculate the integrated TR values over the visible light wavelength range and plot them as a function of the etching time (or a combination of cleaning conditions).
Figure 3 illustrates the increase in integrated TR value with progressive cleaning. Consequently, we can set a target value (70 % TR against Spectralon diffuse white 99% reflectance standard) to ensure good cleaning for surface cleanliness control in production.
Colourimetry
This technique measures the colour of the aluminium surface which is, again, strongly influenced by the level of cleaning. As described in my previous blog, aluminium is normally silver white in colour, whilst the disturbed layer has a brown colour.
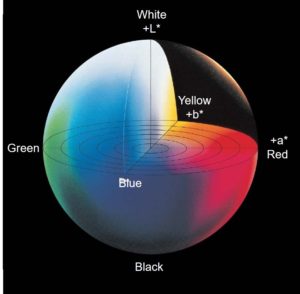
The colour measurement is performed in a quantitative way using a colourimeter. We record the results using the L*a*b* colour space, Figure 4. The L*a*b* colour space has dimensions L* for lightness and a* and b* for the colour dimensions. +a* is the red direction and -a* is the green direction, +b∗ is the yellow direction and -b∗ is the blue direction.
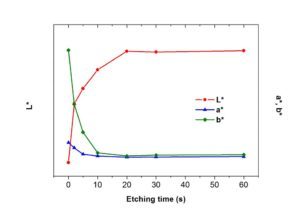
With progressive aluminium etching, the lightness value L* shows a very similar profile to the integrated TR, Figure 5. This is because both are basically the same and respond to the brightness of the sheet surfaces.
The a* and b* values gradually decrease with the increasing level of cleaning until all the disturbed layer has been removed. Once again, we can set target values to achieve good cleaning for cleanliness control in production.
Evaluating your aluminium etching process
The Materials Testing team at Innoval have expertise in the use of the techniques I’ve described in this blog. We either use our in-house equipment or we use the equipment at nearby universities. Our extensive in-house characterisation and analysis capabilities can find out the cause of most surface problems relating to cleaning. This includes both cosmetic corrosion and adhesive bond durability.
Finally, cleaning, pretreatment and corrosion are just some of the topics we cover in our Aluminium Automotive Sheet Training Course. The next one will take place on 6-8th November 2018 here in Banbury. It will be 2.5 days long and includes a visit to Jaguar Land Rover’s Castle Bromwich manufacturing plant. You can download a registration form from the training course link above.
Source of Figure 4: https://www.konicaminolta.com/instruments/knowledge/color/pdf/color_communication.pdf